The College surveyed members in April about the impact of COVID-19 on their practices. Three months later, we were curious to see how things had changed. Were allergy practices recovering? How were they handling clinical issues like spirometry, peanut OIT, and testing for COVID-19? What were their thoughts on telemedicine, having used it for three months? Our follow-up member survey helped answer all those questions and more. This article covers patient volumes, safety and practice finances. Clinical service results and general comments will be featured in an upcoming article.
The second survey of U.S. College members took place from 7/30/20 – 8/16/20. A total of 291 members completed the survey, for a completion rate of 8.5%. The demographics for this survey mirrored those from the previous survey. Following are demographics from the August survey:
- 70% of all survey respondents came from single specialty private practice, 11% were from multi-specialty private practice, 8% were academic and 7% were from integrated health systems.
- 80% of all survey respondents had five or fewer providers in their practice, 11% had six to 10 providers, 5% had 11-20 providers and 4% had more than 20 providers.
- Survey responses were evenly divided across all five regions of the United States.
- 94% of respondents were providers and 6% were office managers/administrators.

Patient volumes and visit types
The good news is that August survey respondents reported increased patient volumes across the board relative to what was reported in April. However, volumes are not yet at pre-pandemic levels.
- 91% of August survey respondents said they were currently seeing patients at their office, compared to 78% in the April survey.
In-person visits
In both surveys, we asked how current office hours for in-person visits compare to the same time last year.
- In the August survey, more than half of all respondents said their office hours for in-person visits were now at the same level as last year, compared with only 24% in April.
- We created a weighted average response* for this question to compare results from both surveys. A lower weighted average reflects a less negative impact on in-person office hours (a weighted average of 0 would mean no change in office hours compared to last year).
- The weighted average result for August was 20.2% compared to 49.5% in April. So, while many allergists continued to report a reduction in in-person office hours in August, office hours did improve from the April survey.
How do your current office hours for in-person visits compare to the same time last year?
| August Survey | April Survey | |
|---|---|---|
| # Respondents | 241 | 312 |
| No change | 51.9% | 24.4% |
| <25% reduced | 26.6% | 17.9% |
| 26-50% reduced | 12.9% | 18.3% |
| 51-75% reduced | 6.2% | 14.1% |
| >75% reduced | 2.5% | 25.3% |
| Weighted Average* | 20.2% | 49.5% |
| Sources: ACAAI COVID Member Survey 7/30/20 – 8/16/20 and ACAAI COVID Member Survey 4/24/20 – 5/3/20. Copyright 2020. Data is protected by ACAAI copyright and is prohibited to be shared or published without ACAAI’s consent. | ||
*Weighted Avg. is calculated by multiplying “no change” by 0, “<25% reduced” by 0.25, “26-50% reduced” by 0.5, “51-75% reduced” by 0.75, and “>75% reduced” by 1.
Total Patient Volumes
In both surveys, we asked how total patient volumes (in person, telemedicine and telephone combined) compare to normal operations at this time of the year.
- Reported total patient volumes improved in August relative to reported volumes in April.
- In the April survey, 64% of respondents reported reduced patient volumes of more than 50%, compared to only 9% in the August survey.
- We created a weighted average response* for this question to better compare the results from both surveys. A lower weighted average reflects a less negative impact on total patient volume (a weighted average of 0 would mean no change in total patient volume compared to last year).
- The weighted average result for August was 32.9% compared to 72.3% in April. This means that while many allergists continued to report a reduction in total patient volume in August, patient volume did increase significantly from the April survey.
How does your current overall patient visit volume (in-person, telemedicine and telephone combined) compare to your normal operations at this time of the year?
| August Survey | April Survey | |
|---|---|---|
| # Respondents | 257 | 363 |
| Increase or no change | 19.9% | 0.3% |
| <=25% reduced | 39.3% | 5.5% |
| 26-50% reduced | 30.4% | 30.3% |
| 51-75% reduced | 5.8% | 31.4% |
| >75% reduced | 3.5% | 32.2% |
| Not Sure | 1.2% | 0.3% |
| Weighted Average* | 32.9% | 72.3% |
| Sources: ACAAI COVID Member Survey 7/30/20 – 8/16/20 and ACAAI COVID Member Survey 4/24/20 – 5/3/20. Copyright 2020. Data is protected by ACAAI copyright and is prohibited to be shared or published without ACAAI’s consent. | ||
*Weighted Avg. is calculated by multiplying “no change” by 0, “<=25% reduced” by 0.25, “26-50% reduced” by 0.5, “51-75% reduced” by 0.75, and “>75% reduced” by 1.
Therapy service volumes
- August survey respondents reported volume increases across all clinical services compared to the April survey, including AIT, Biologics, Venom and Food OIT.
- Biologics and venom patient volumes were less impacted by the pandemic compared to AIT and Food OIT, which took a bigger hit.
- 76% of August survey respondents said biologics were at least the same level as last year, and 63% said venom was at least the same level as last year.
August COVID-19 Survey: What is your current in-person patient volume for each of the below clinical services compared to your normal operations at this time of the year?
| AIT | Biologics | Venom | Food OIT | |
|---|---|---|---|---|
| # Respondents | 241 | 241 | 240 | 241 |
| Increase or no change | 25.7% | 76.0% | 63.3% | 19.1% |
| <=25% reduced | 48.6% | 15.8% | 21.3% | 6.2% |
| 26-50% reduced | 19.1% | 2.5% | 2.5% | 4.6% |
| 51-75% reduced | 3.7% | 0.4% | 1.3% | 2.5% |
| >75% reduced | 2.1% | 0.4% | 1.2% | 5.0% |
| N/A | 0.8% | 5.0% | 10.4% | 62.7% |
| Source: ACAAI COVID Member Survey 7/30/20 – 8/16/20. Copyright 2020. Data is protected by ACAAI copyright and is prohibited to be shared or published without ACAAI’s consent. | ||||
Telemedicine volumes
- Prior to COVID-19, allergists reported only 1% of all patient visits were conducted via telemedicine.
- After COVID-19 hit, April survey respondents reported telemedicine visits jumped to 54% of all patient visits, and in-person visits dropped to 30%.
- By August, in-person visits recovered somewhat. Telemedicine visits dropped to 23%, with in-person visits increasing to 66% of all visits.
- For more details on survey results related to telemedicine, view our recent Advocacy Insider article Telemedicine use: Where are allergists now?
Approximately what percentage of all patient visits are in-person, by telephone and by telemedicine at your practice? (August: 252 responses, April: 351 responses)
| August Survey | April Survey | |
|---|---|---|
| % In-person visits | 66% | 30% |
| % Telemedicine visits (audio and visual) | 23% | 54% |
| % Telephone visits (audio only) | 11% | 16% |
| Sources: ACAAI COVID Member Survey 7/30/20 – 8/16/20 and ACAAI COVID Member Survey 4/24/20 – 5/3/20. Copyright 2020. Data is protected by ACAAI copyright and is prohibited to be shared or published without ACAAI’s consent. | ||
Office safety
According to our surveys, allergist access to PPE improved over the past three months. Perceived risk to allergists and staff did not change.
- Practices reported having an easier time obtaining an adequate supply of PPE in the August survey relative to the April survey.
- In August, 86% said they had been able to maintain an adequate supply of PPE, compared with only 67% in April.
Has your office been able to maintain an adequate supply of PPE? (August: 241 responses, April: 315 responses)
| August Survey | April Survey | |
|---|---|---|
| % Yes | 85.5% | 66.7% |
| % No | 14.5% | 33.3% |
| Sources: ACAAI COVID Member Survey 7/30/20 – 8/16/20 and ACAAI COVID Member Survey 4/24/20 – 5/3/20. Copyright 2020. Data is protected by ACAAI copyright and is prohibited to be shared or published without ACAAI’s consent. | ||
- When asked to describe their perceived level of staff risk for COVID-19, respondents reported similar results for both the August and April surveys.
- In both surveys, providers and clinical staff were perceived to have higher risk than nonclinical staff. For providers and clinical staff, about 45% of August respondents reported some risk and 18% indicated moderate risk.
- For nonclinical staff, 30% said some risk and 7% reported moderate risk.
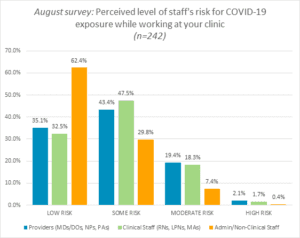
Source: ACAAI COVID Member Survey 7/30/20 – 8/16/20. Copyright 2020. Data is protected by ACAAI copyright and is prohibited to be shared or published without ACAAI’s consent.
Practice finances and financial assistance
A majority of allergists reported declines in charges over the prior year and a need for financial assistance since the pandemic.
- 79% of August survey respondents said their charges from March through July 2020 have declined from the same period last year.
- Close to 40% saw a 26-50% decrease over last year, 24% saw a 0-25% decrease, and 13% experienced a 51-75% decrease. 16% weren’t sure, and 4% didn’t experience any decline over the prior year.
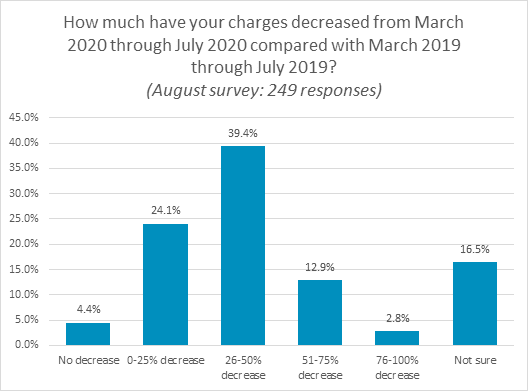
Source: ACAAI COVID Member Survey 7/30/20 – 8/16/20. Copyright 2020. Data is protected by ACAAI copyright and is prohibited to be shared or published without ACAAI’s consent.
- Many allergists reported receiving financial assistance. The Paycheck Protection Program (PPP) is the most popular loan program, with 65% responding they received or expected to receive a PPP loan.
- 35% received or expected to receive funds from the Health and Human Services (HHS) Provider Relief Program.
Which of the following COVID-19-related forms of financial assistance have you received or expect to receive? (Check all that apply) (August survey: 240 responses)
| Financial Assistance | % |
|---|---|
| Paycheck Protection Program (PPP) Loan under CARES Act | 65.4% |
| HHS Stimulus Payments (Provider Relief Grant Program) | 35.4% |
| Medicare Advanced Payments Program | 22.5% |
| SBA Emergency Economic Injury Disaster Loan (EIDL) program under CARES Act | 20.4% |
| SBA Debt Relief for existing loans | 2.1% |
| IRS Employee Retention Credit | 1.3% |
| Not Sure | 26.7% |
| Other | 5.0% |
| Sources: ACAAI COVID Member Survey 7/30/20 – 8/16/20 and ACAAI COVID Member Survey 4/24/20 – 5/3/20. Copyright 2020. Data is protected by ACAAI copyright and is prohibited to be shared or published without ACAAI’s consent. | |
Our August survey shows this is still a challenging time for many allergy/immunology practices. Practice financial health and patient volumes have been impacted, but we are seeing movement in a positive direction. Patient volumes and in-person visits are increasing. PPE is more obtainable. And a majority of allergy practices were able to obtain one or more forms of financial assistance.
Know that you are not alone; many practices are facing the same challenges. The College is here to support you through these difficult times. We will continue to provide guidance and resources for the necessary practice changes in response to this pandemic.
Please access our COVID-19 resource page for clinical, coding, telemedicine, practice management, and patient resources to assist you. We encourage you to reach out to your colleagues through DocMatter to share your experiences. Stay tuned for the upcoming article on the impact of COVID-19 on allergy/immunology clinical services, staffing issues, and a summary of respondent comments.
The College would like to thank Drs. Andrew Nickels, Grace Tamesis and Payel Gupta for their work on this survey and this article.